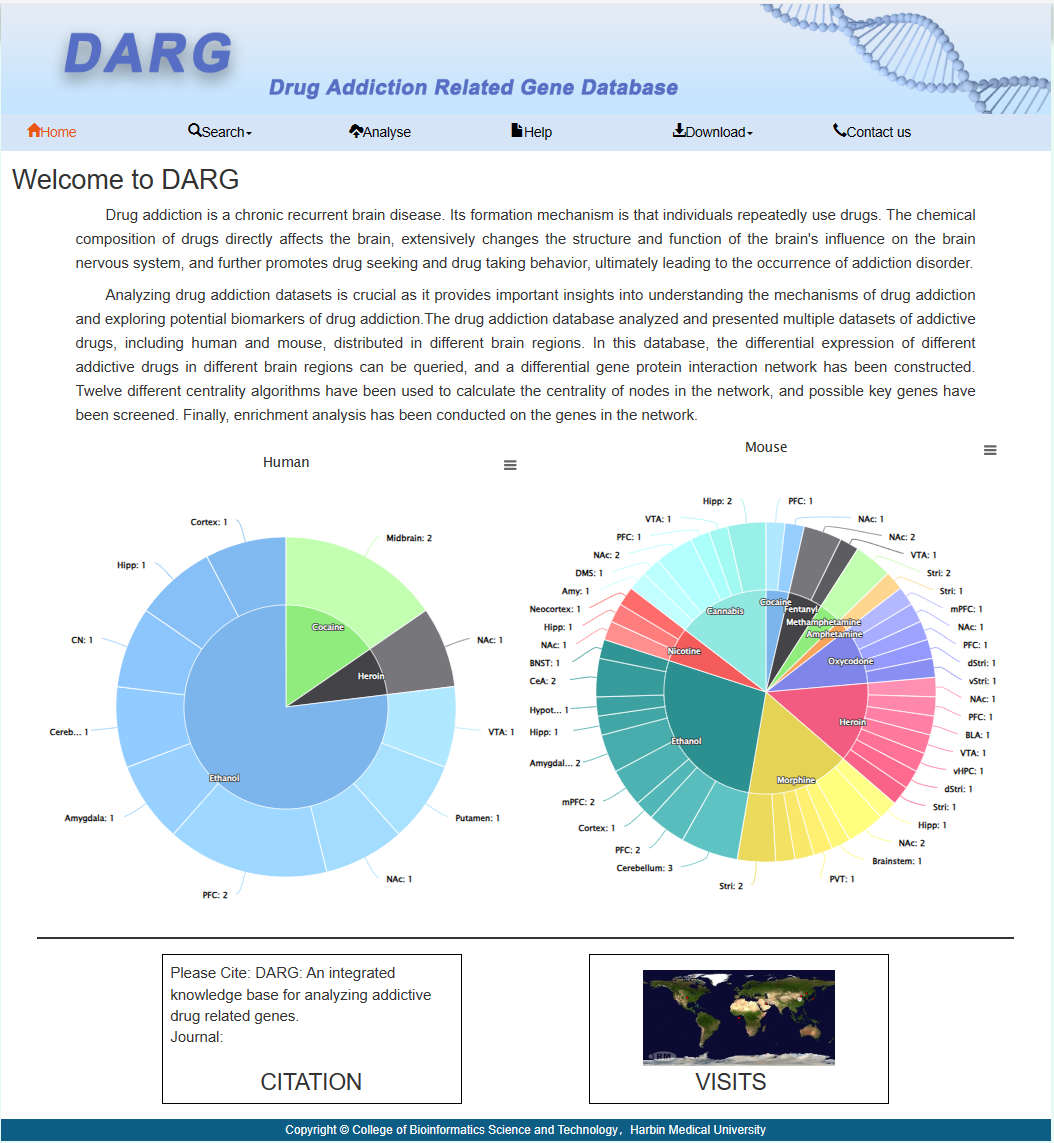
Drug addiction is a chronic recurrent brain disease. Its formation mechanism is that individuals repeatedly use drugs. The chemical composition of drugs directly affects the brain, extensively changes the structure and function of the brain's influence on the brain nervous system, and further promotes drug seeking and drug taking behavior, ultimately leading to the occurrence of addiction disorder.
Analyzing drug addiction datasets is crucial as it provides important insights into understanding the mechanisms of drug addiction and exploring potential biomarkers of drug addiction.The drug addiction database analyzed and presented multiple datasets of addictive drugs, including human and mouse, distributed in different brain regions. In this database, the differential expression of different addictive drugs in different brain regions can be queried, and a differential gene protein interaction network has been constructed. Twelve different centrality algorithms have been used to calculate the centrality of nodes in the network, and possible key genes have been screened. Finally, enrichment analysis has been conducted on the genes in the network.
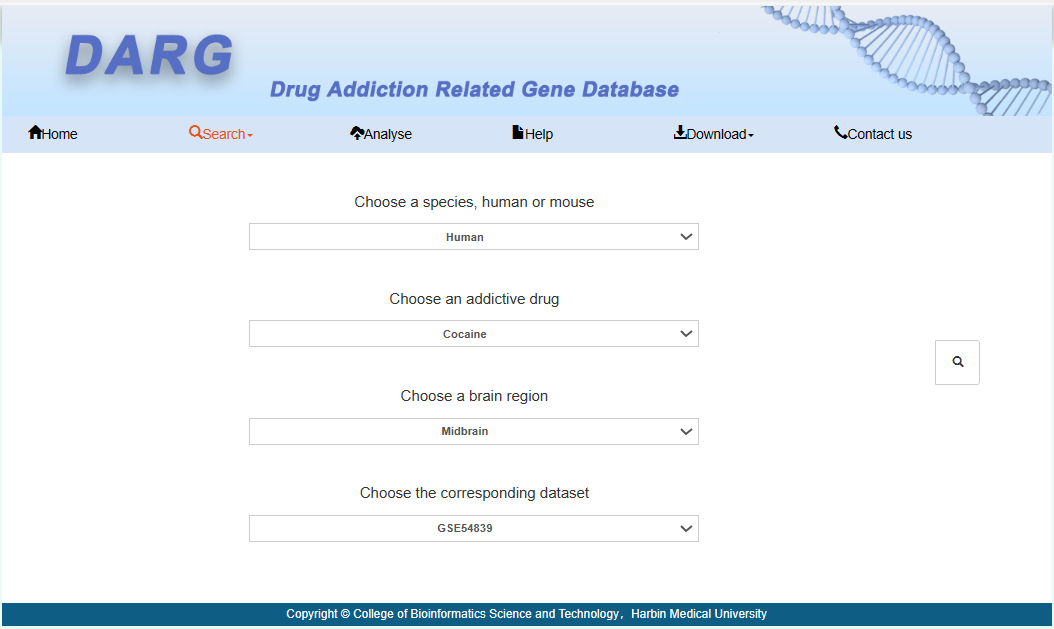
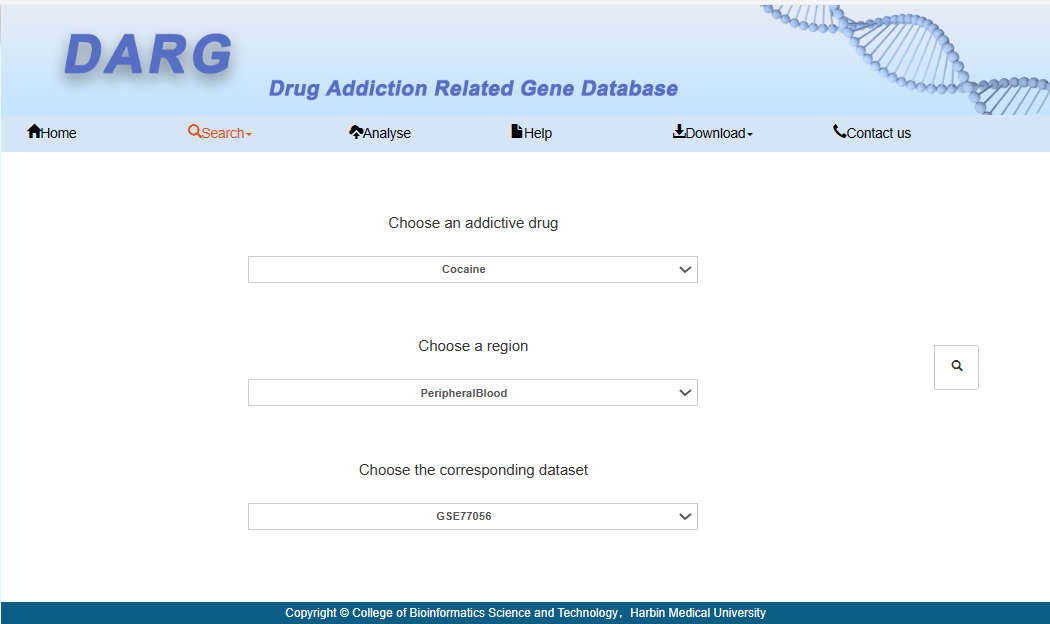
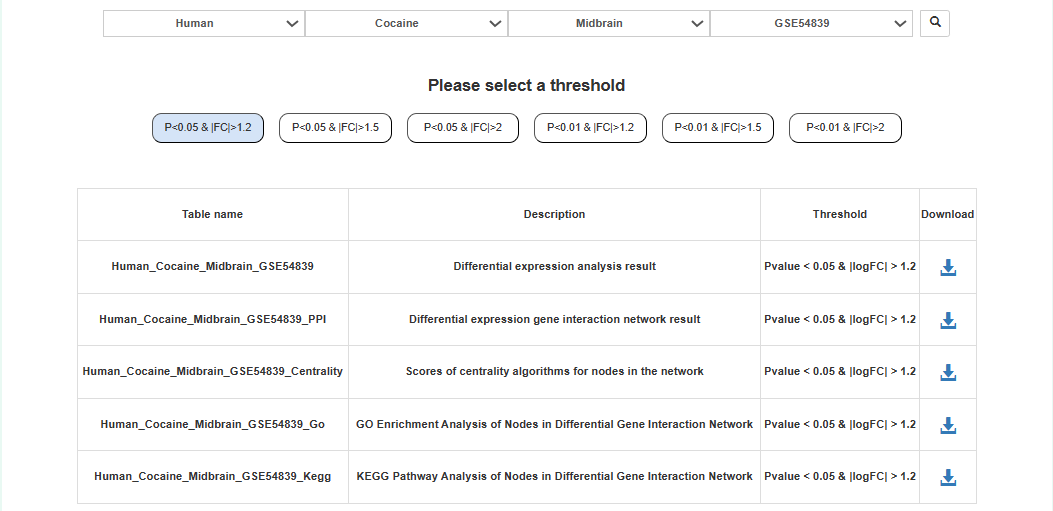
Users can choose species, addictive drugs, brain regions, and datasets to obtain analysis results.
On this page, we provide differential gene information with different thresholds, volcano maps of differential genes, differential gene interaction networks, centrality algorithm results of networks, and enrichment analysis results. Users can click on the GO and KEGG entries to jump to a detailed introduction of functions and pathways.
Differentially expressed genes:

Users can click on the corresponding threshold number to view the analysis results of the corresponding threshold, and click on the icon after the number to see a detailed list of differentially expressed genes corresponding to the threshold.
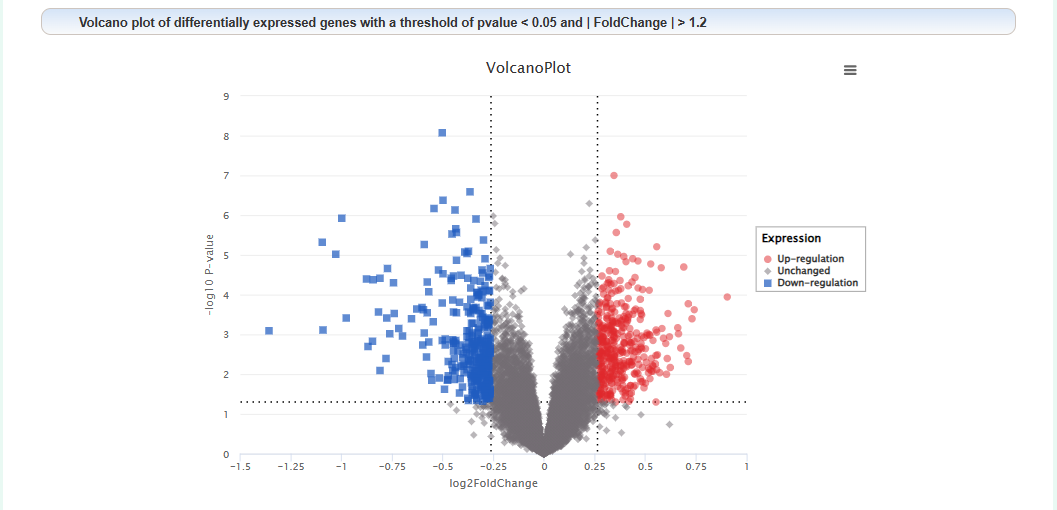
Volcano plot of differentially expressed genes:
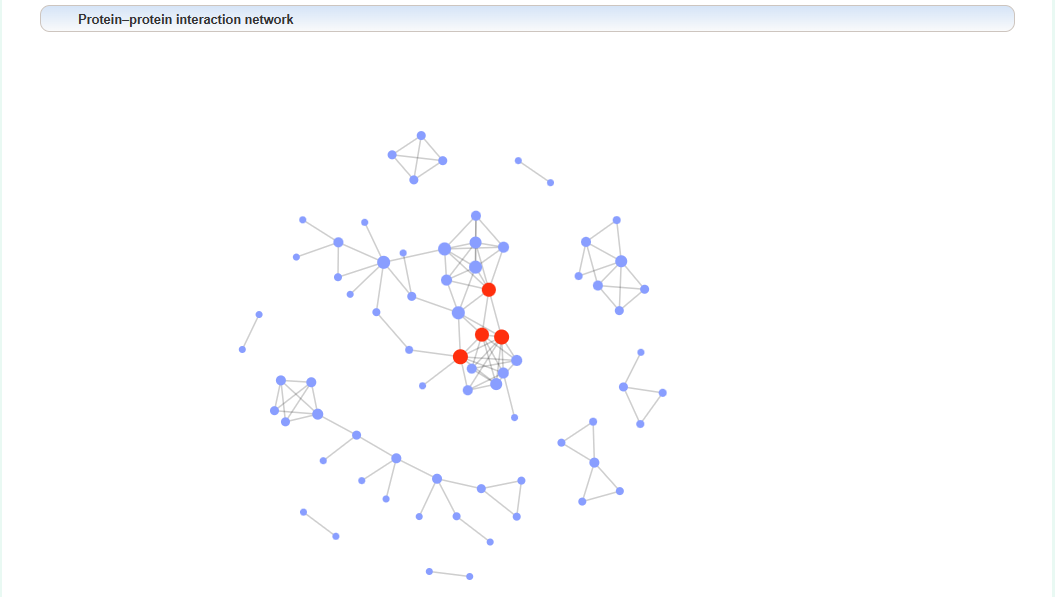
Protein–protein interaction network of differentially expressed genes:
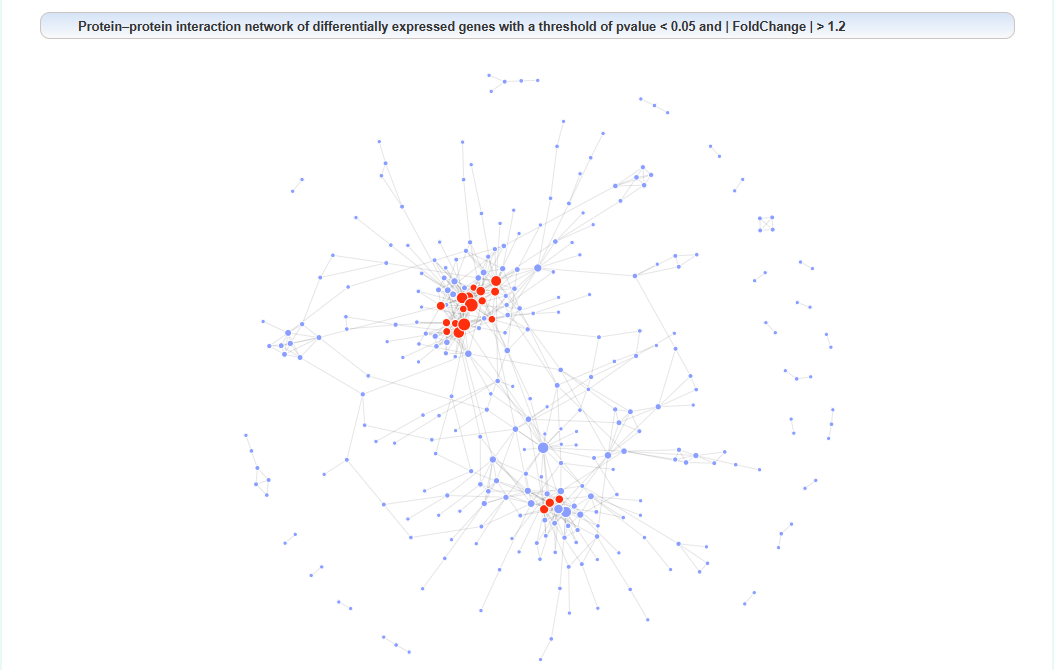
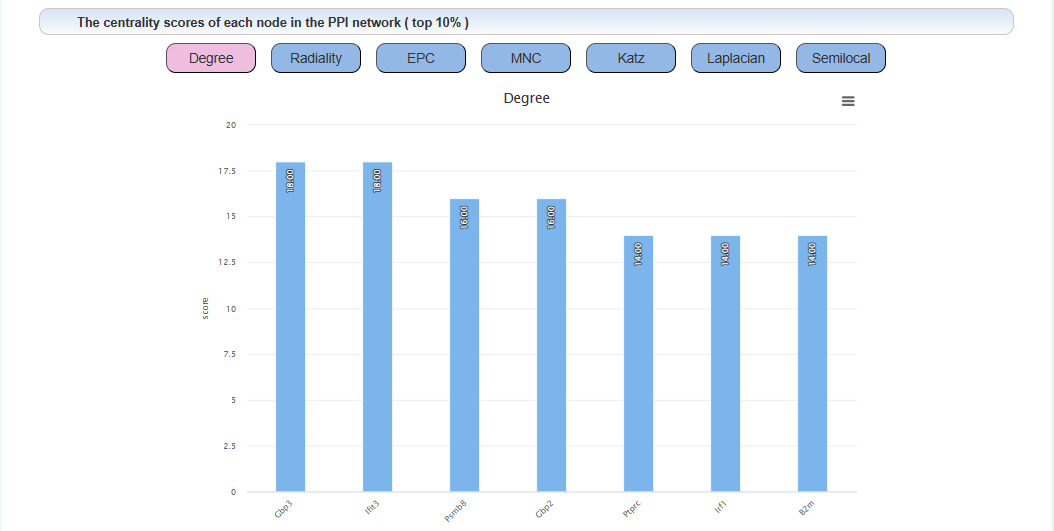
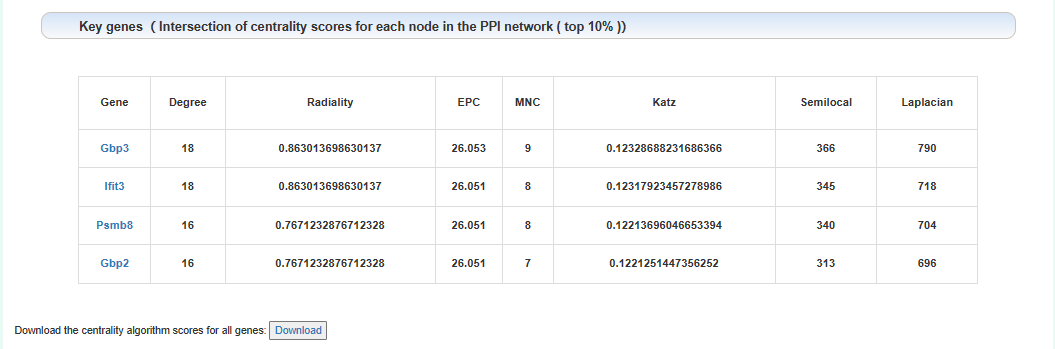
We proposed a centrality algorithm integration strategy to analyze genes in drug addiction-related PPI networks. The scores of the node in network under each centrality algorithm were calculated separately by applying a series of centrality measures, including degree, edge-percolated component (EPC), Laplacian centrality, maximum neighborhood component (MNC), Katz radiality, and semi-local centrality (SLC). The intersection of the top 10% genes of each centrality algorithm was considered the key gene. In the network, red represents key genes.
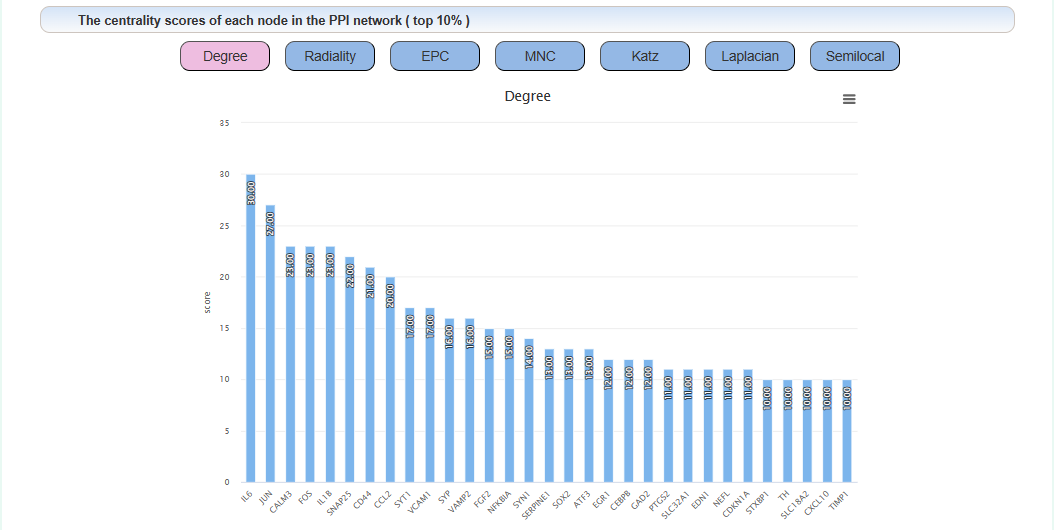
The centrality score of each node in the PPI network:
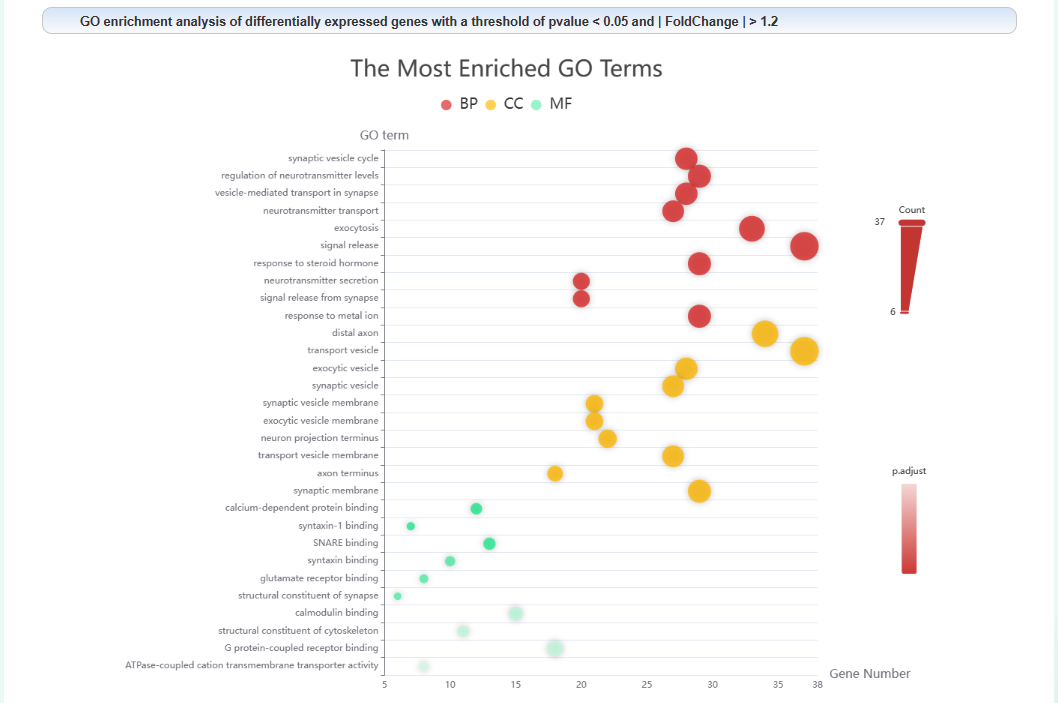
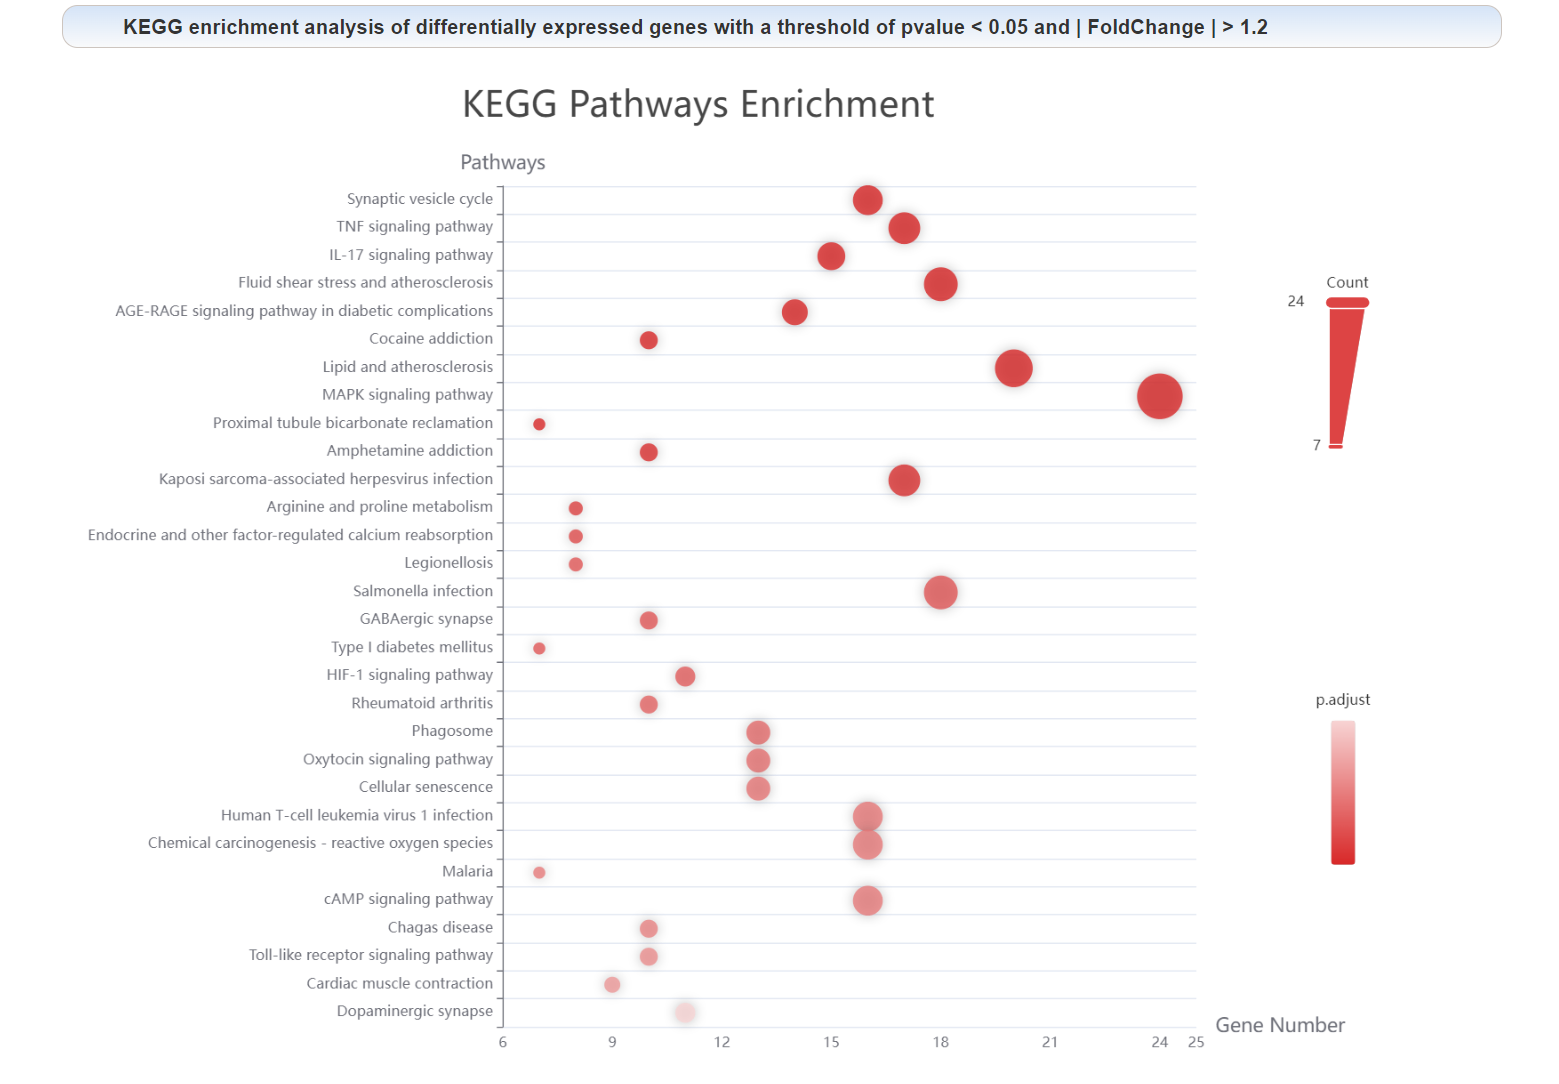
Enrichment analysis of each node in the PPI network:
A detailed list of differentially expressed genes, with red indicating that the gene is a key gene.
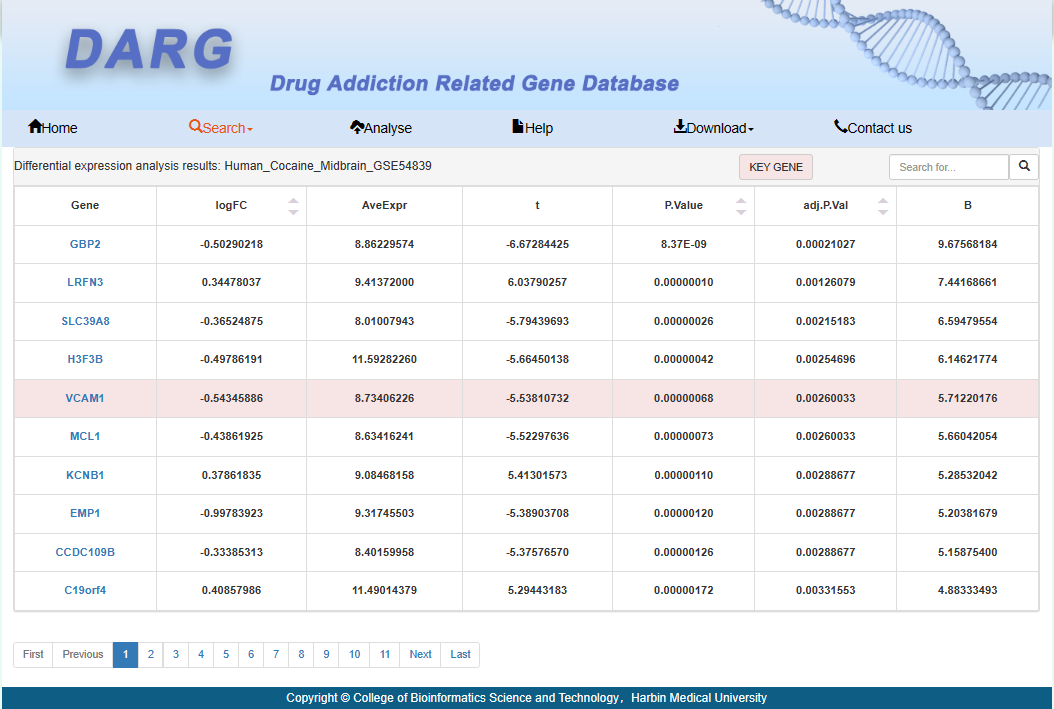
Users can click on the differential gene name to obtain detailed information about the gene.
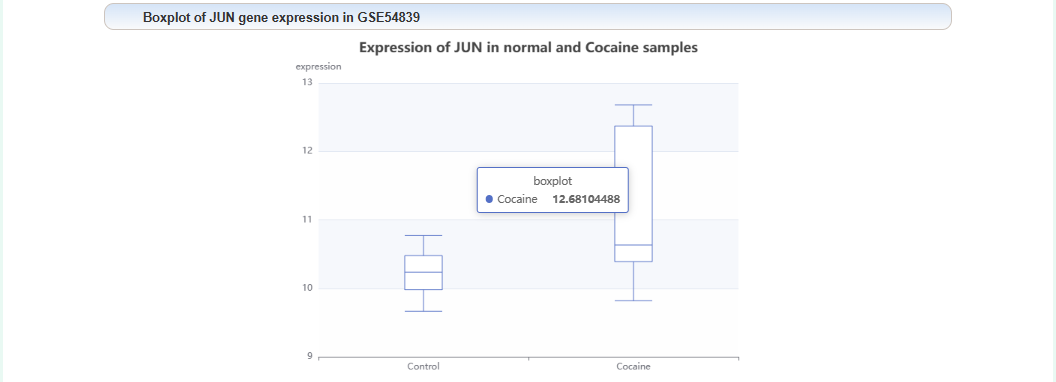
Box plot of gene expression levels:
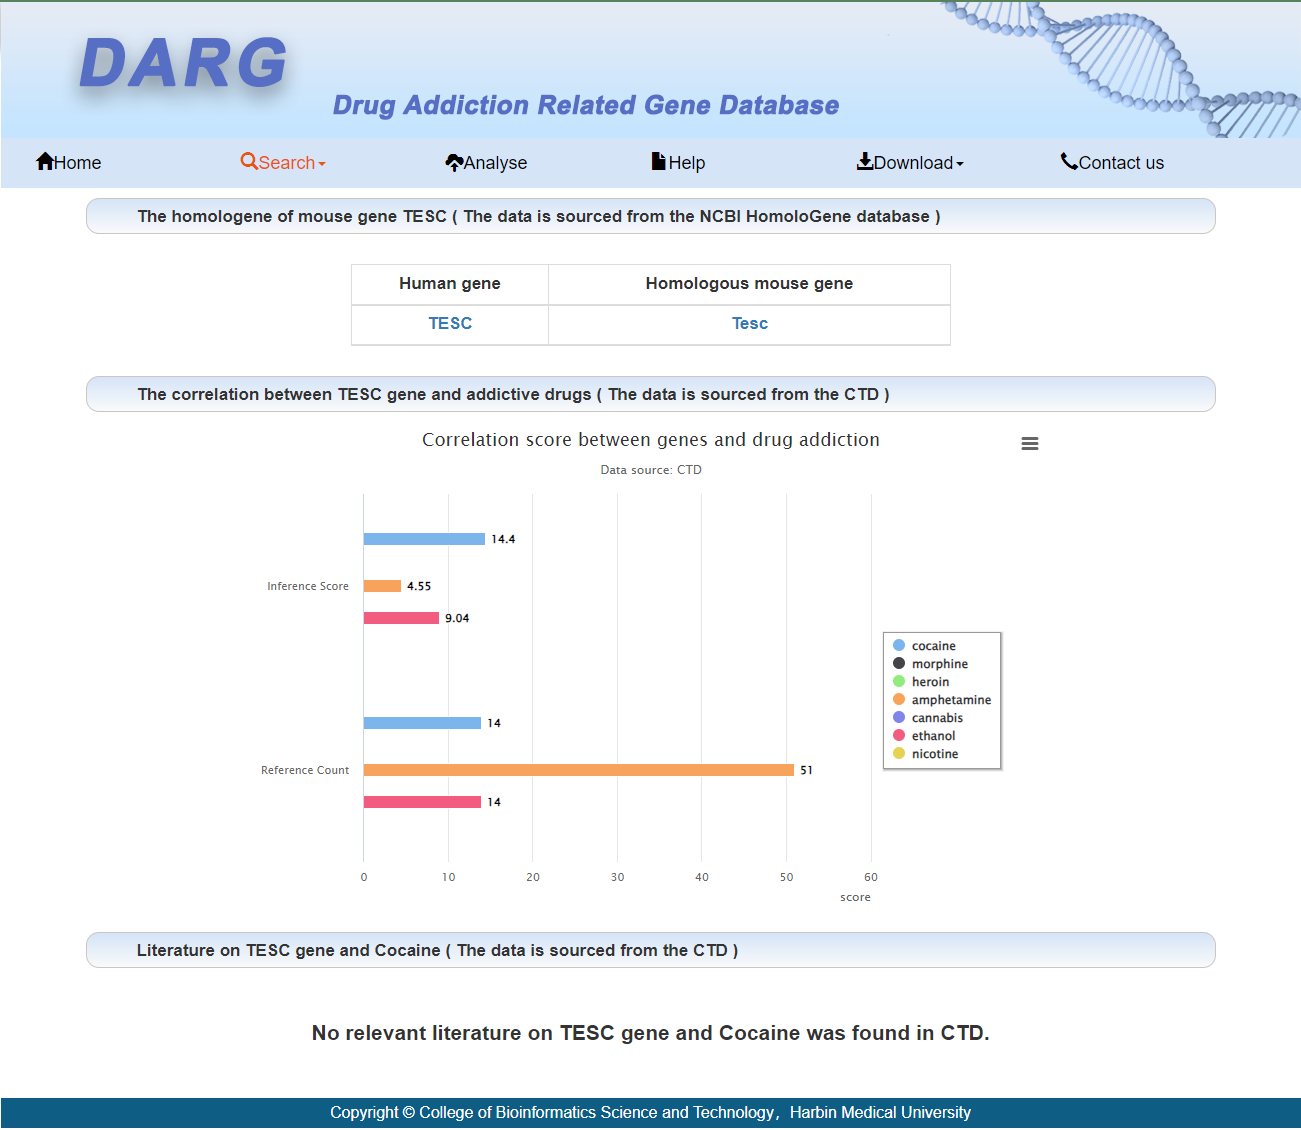
The homologous gene of this gene:

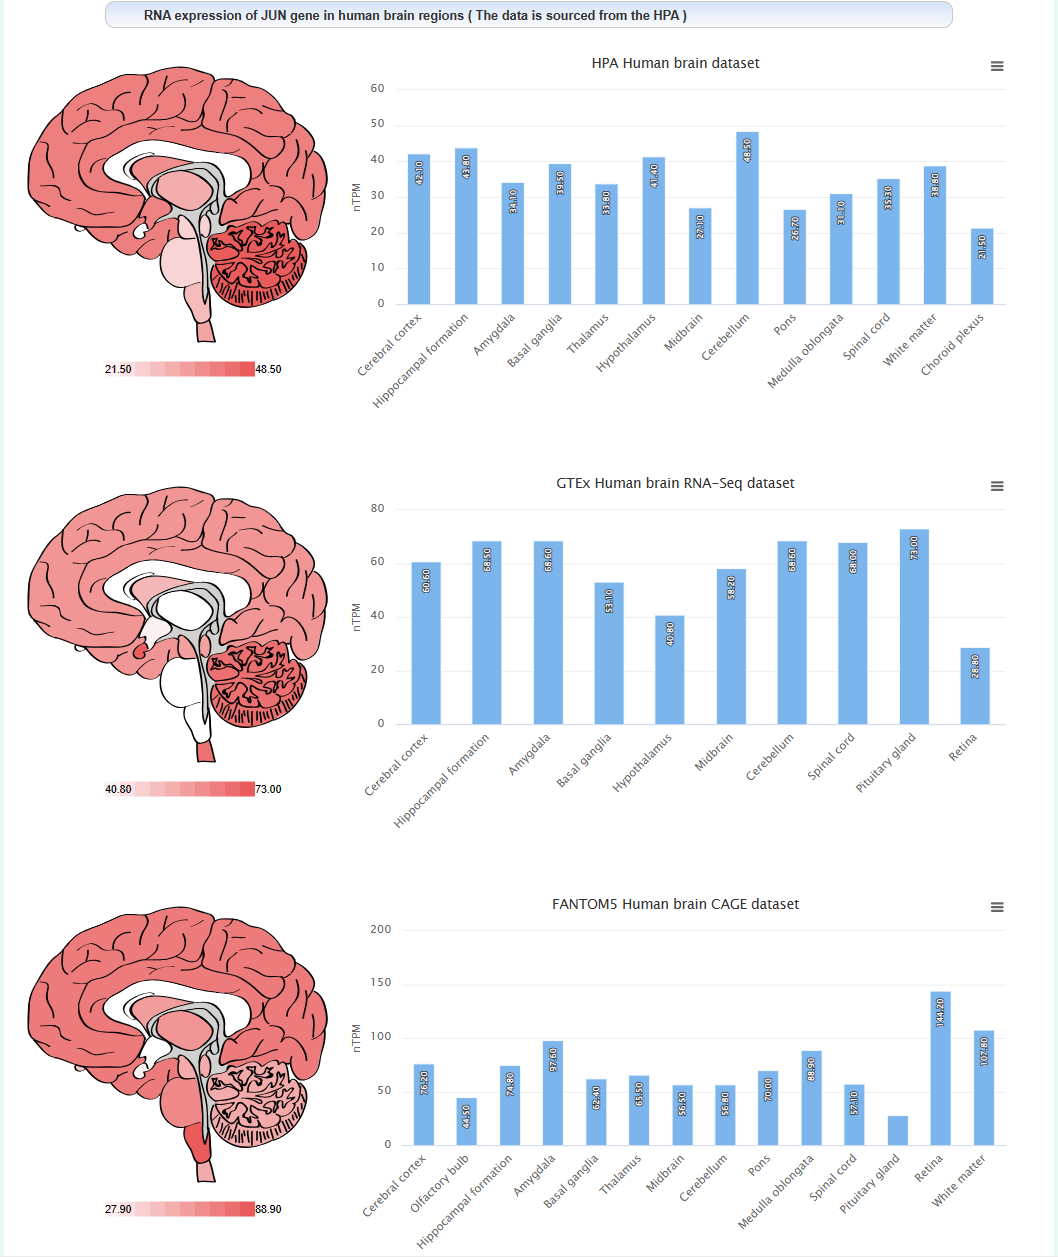
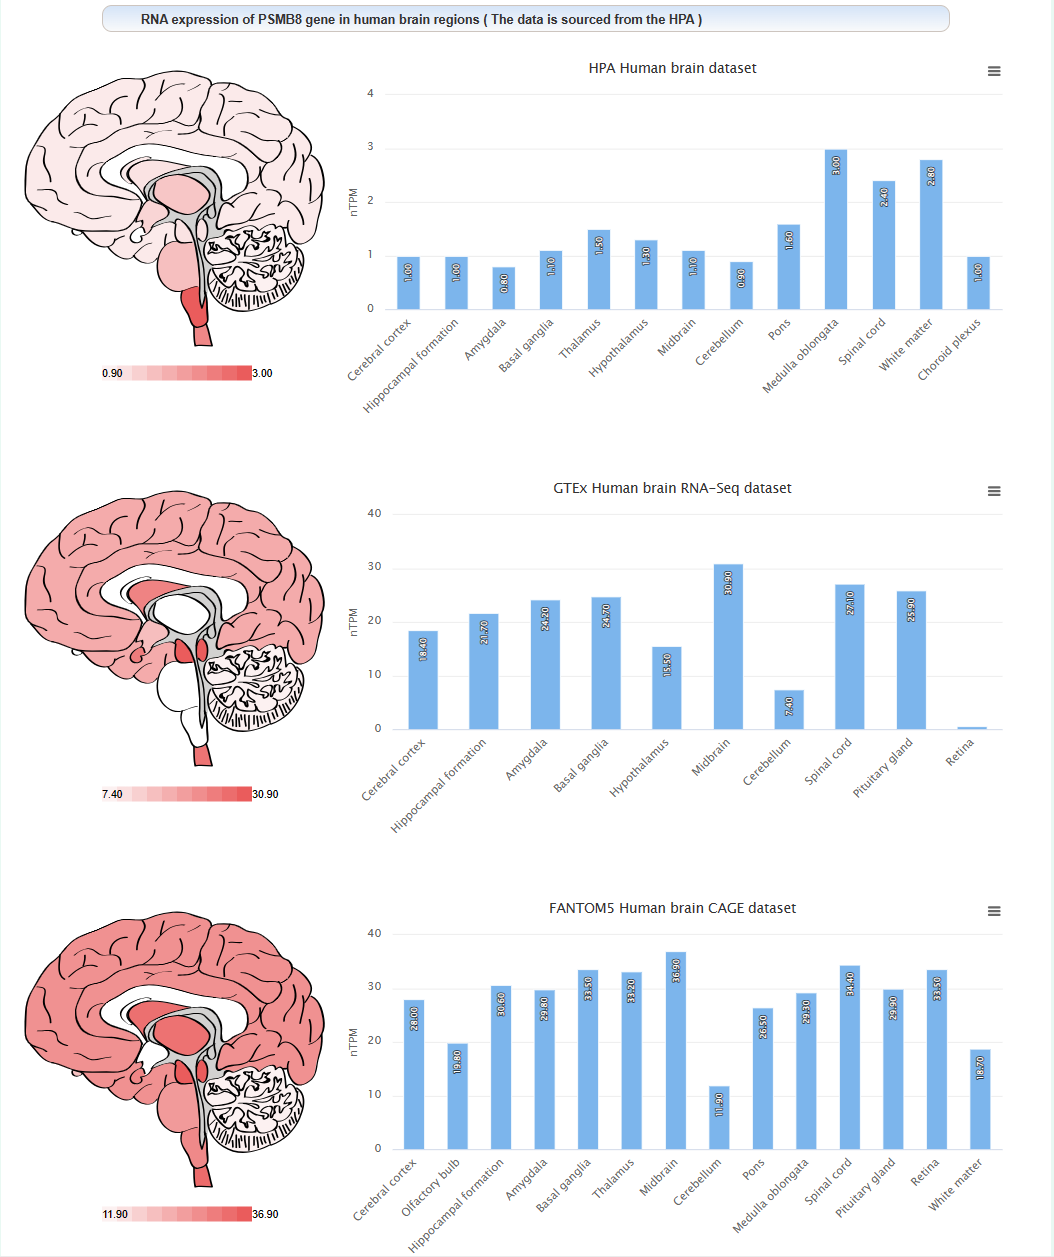
The expression level of this gene in different brain regions of human:
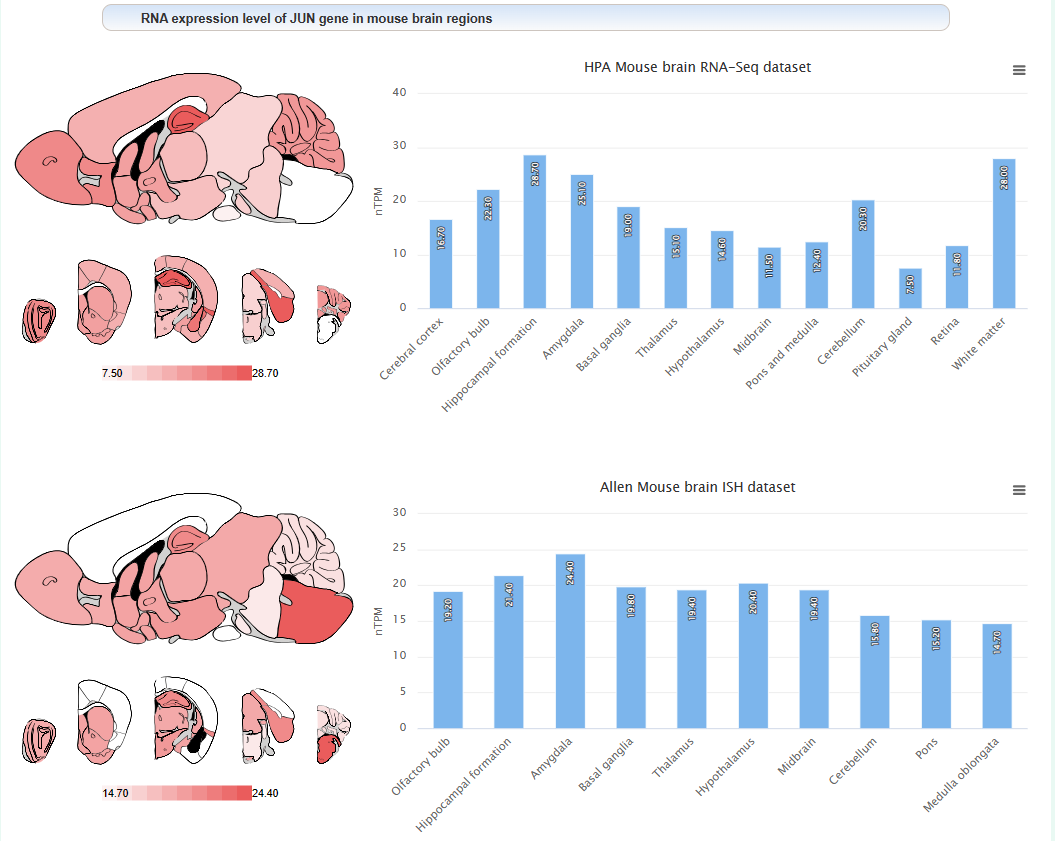
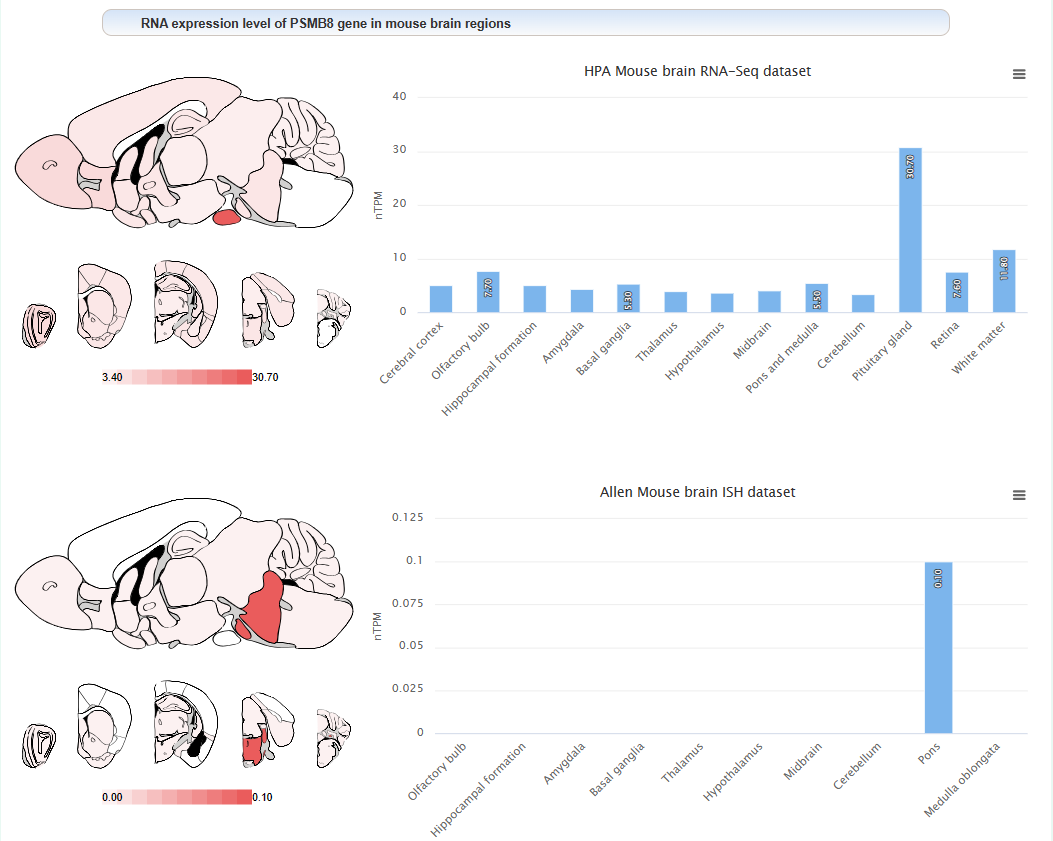
The expression level of this gene in different brain regions of mouse:
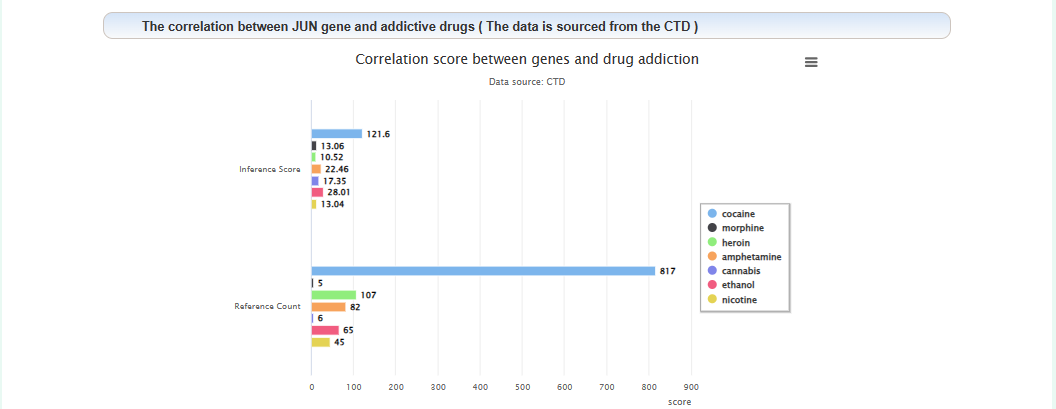
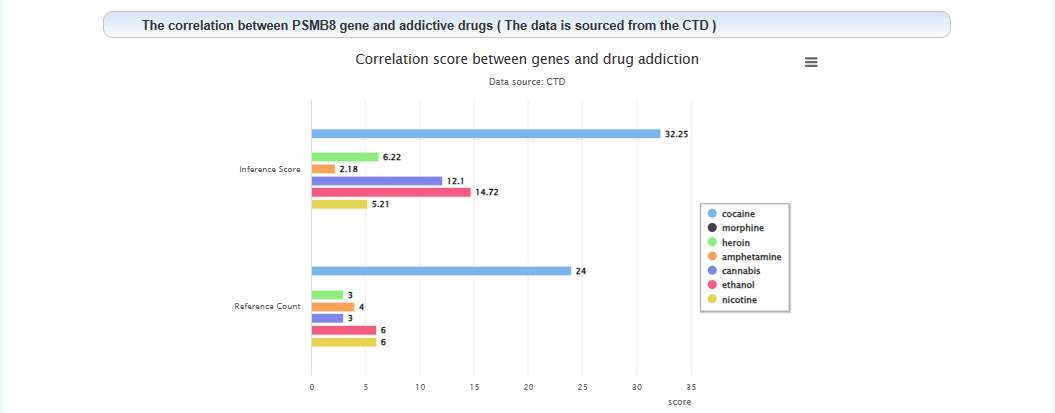
The correlation between this gene and addiction:
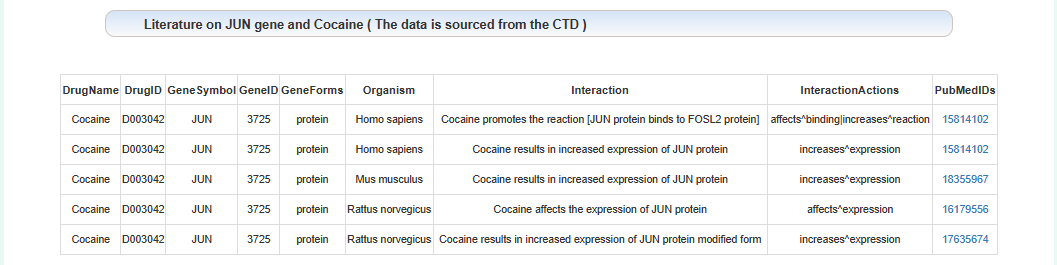
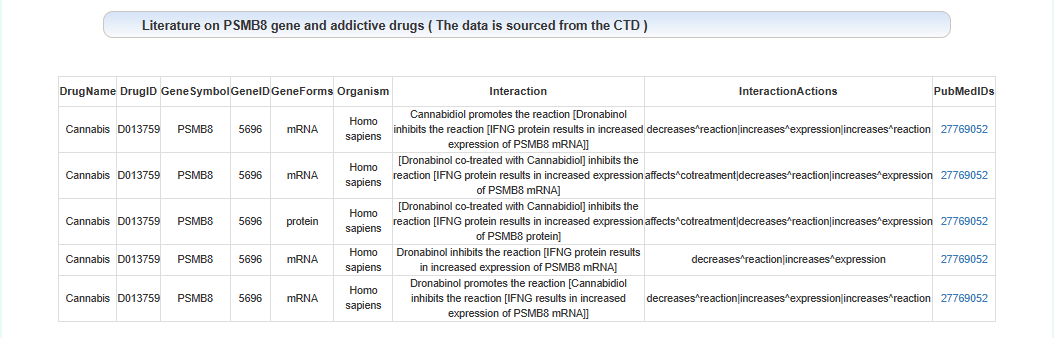
Literature on the relationship between this gene and addiction:
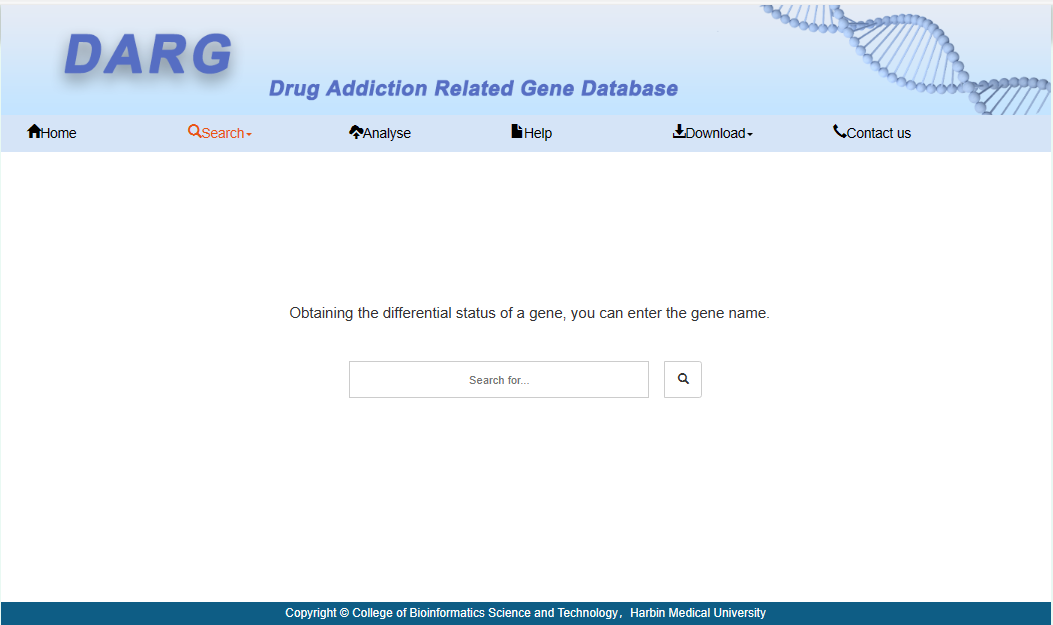
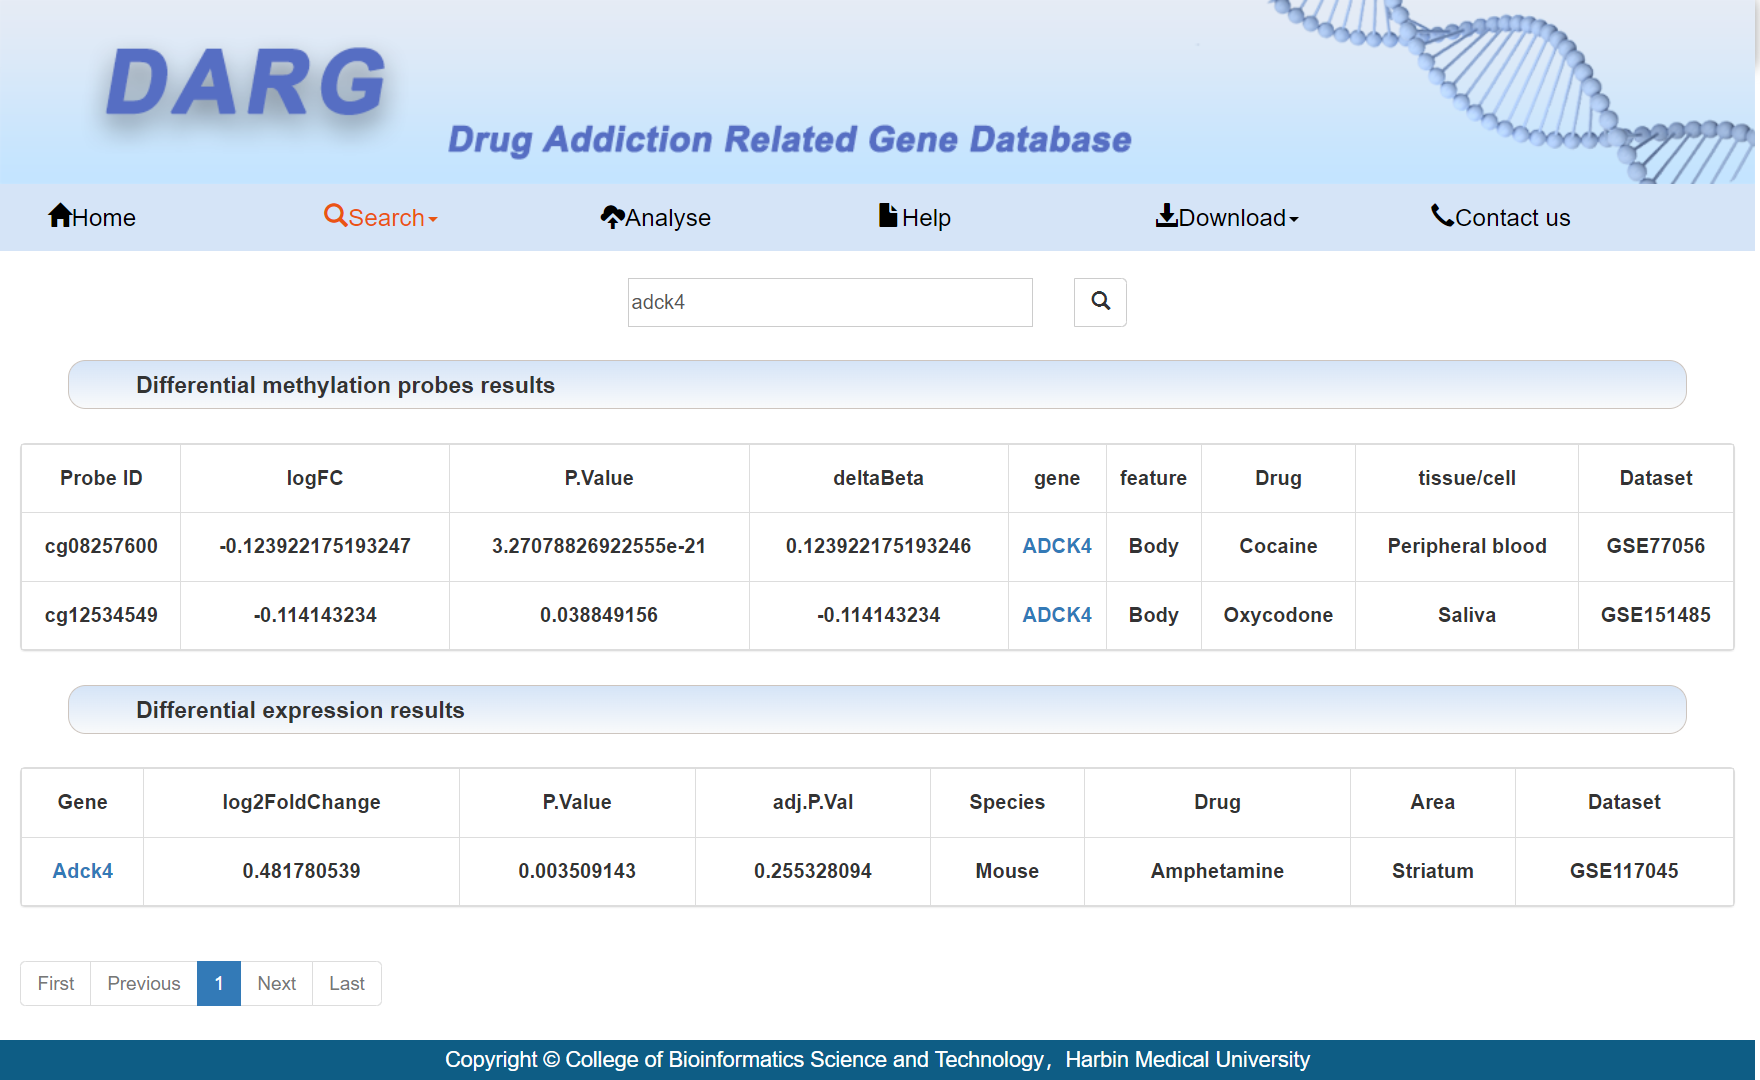
Users can enter gene name query results.
At the top of the page are the differential methylation probes results. At the bottom of the page are the differential expression results. Users can click on the gene name to obtain detailed information about the gene.
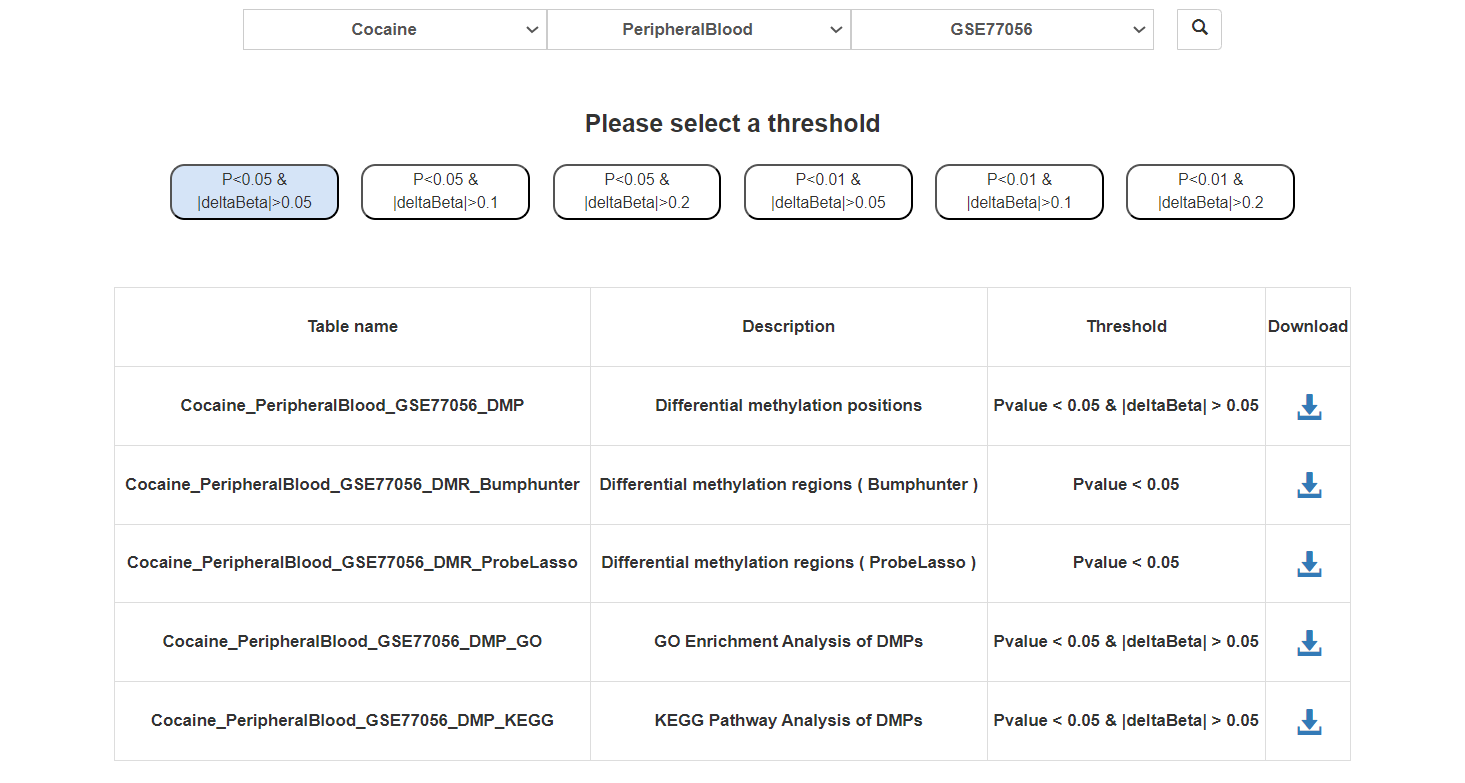
Users can choose addictive drugs, regions, and datasets to obtain methylation analysis results.
DMPs and DMRs:
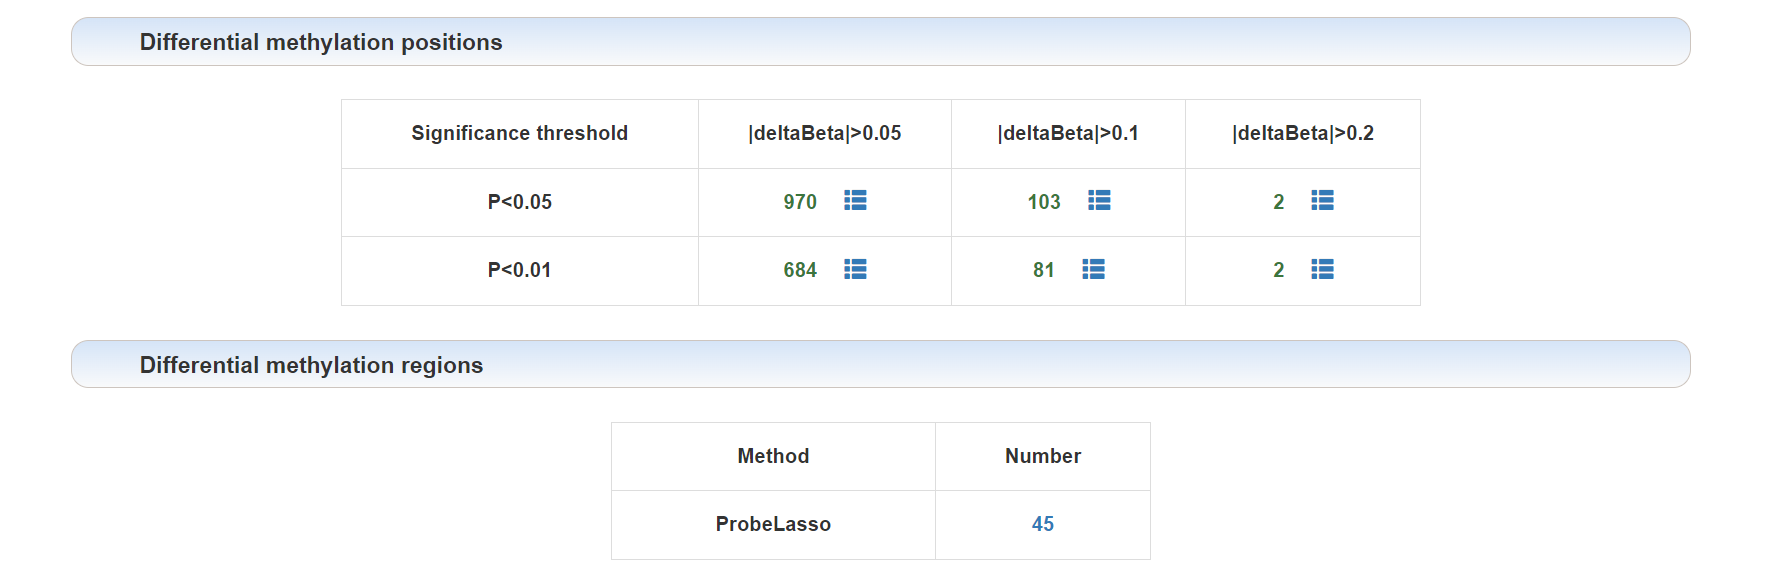
Click on the corresponding threshold for DMPs or the method for DMRs to view a detailed list.
Volcano plot of DMPs:

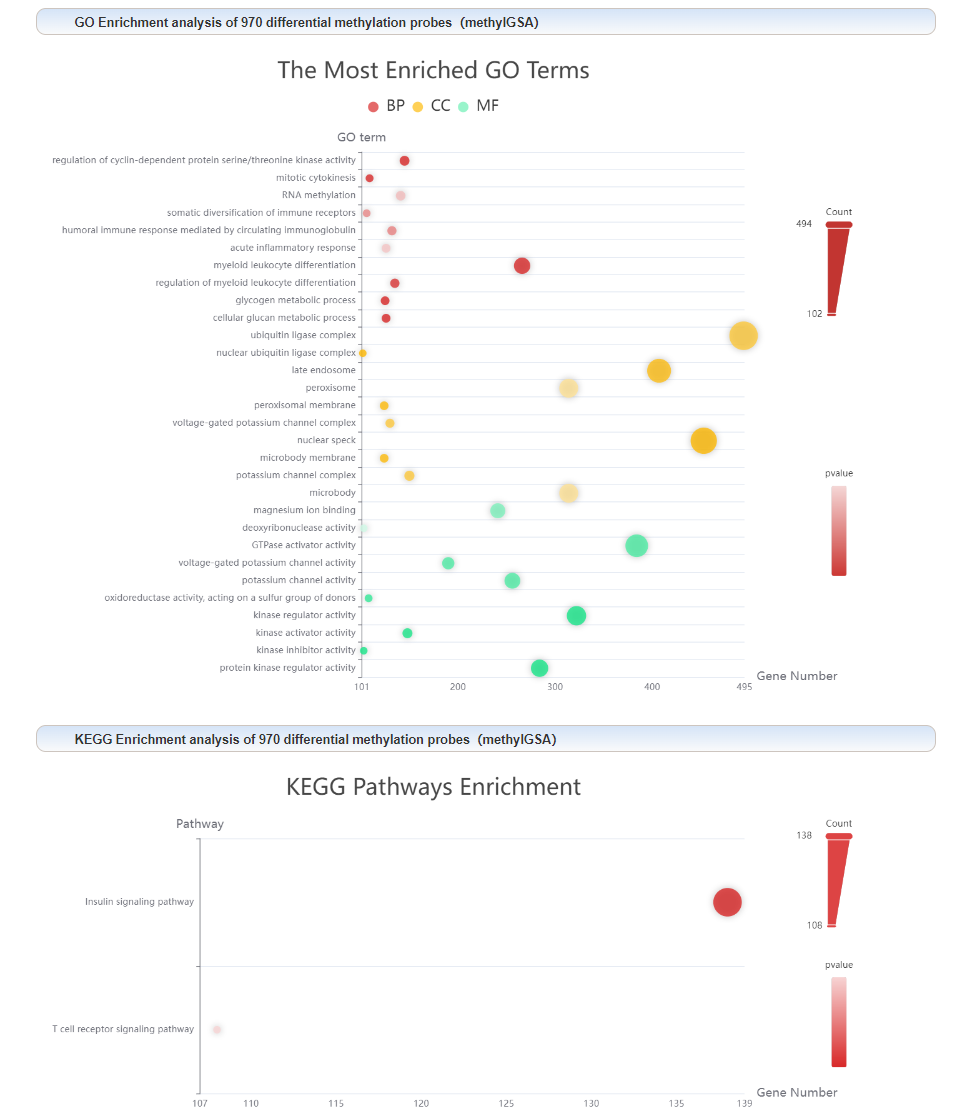
GO and KEGG enrichment analysis results:
A detailed list of DMPs:
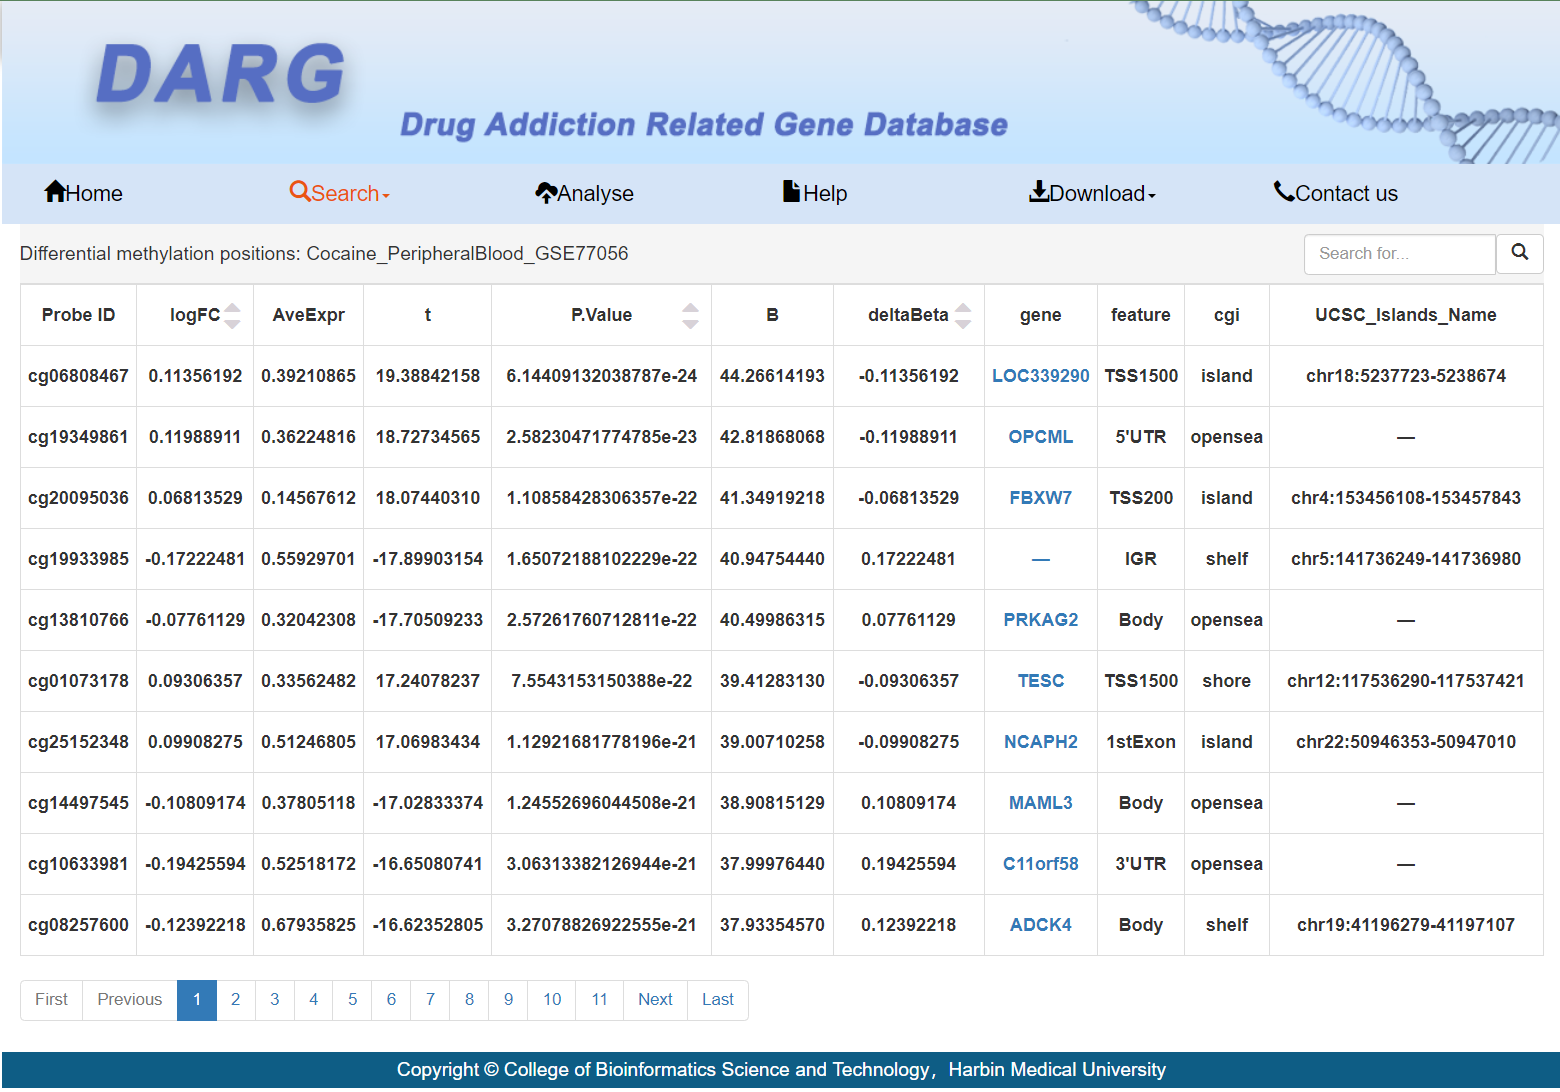
Users can click on the differential gene name to obtain detailed information about the gene.
A detailed list of DMRs:
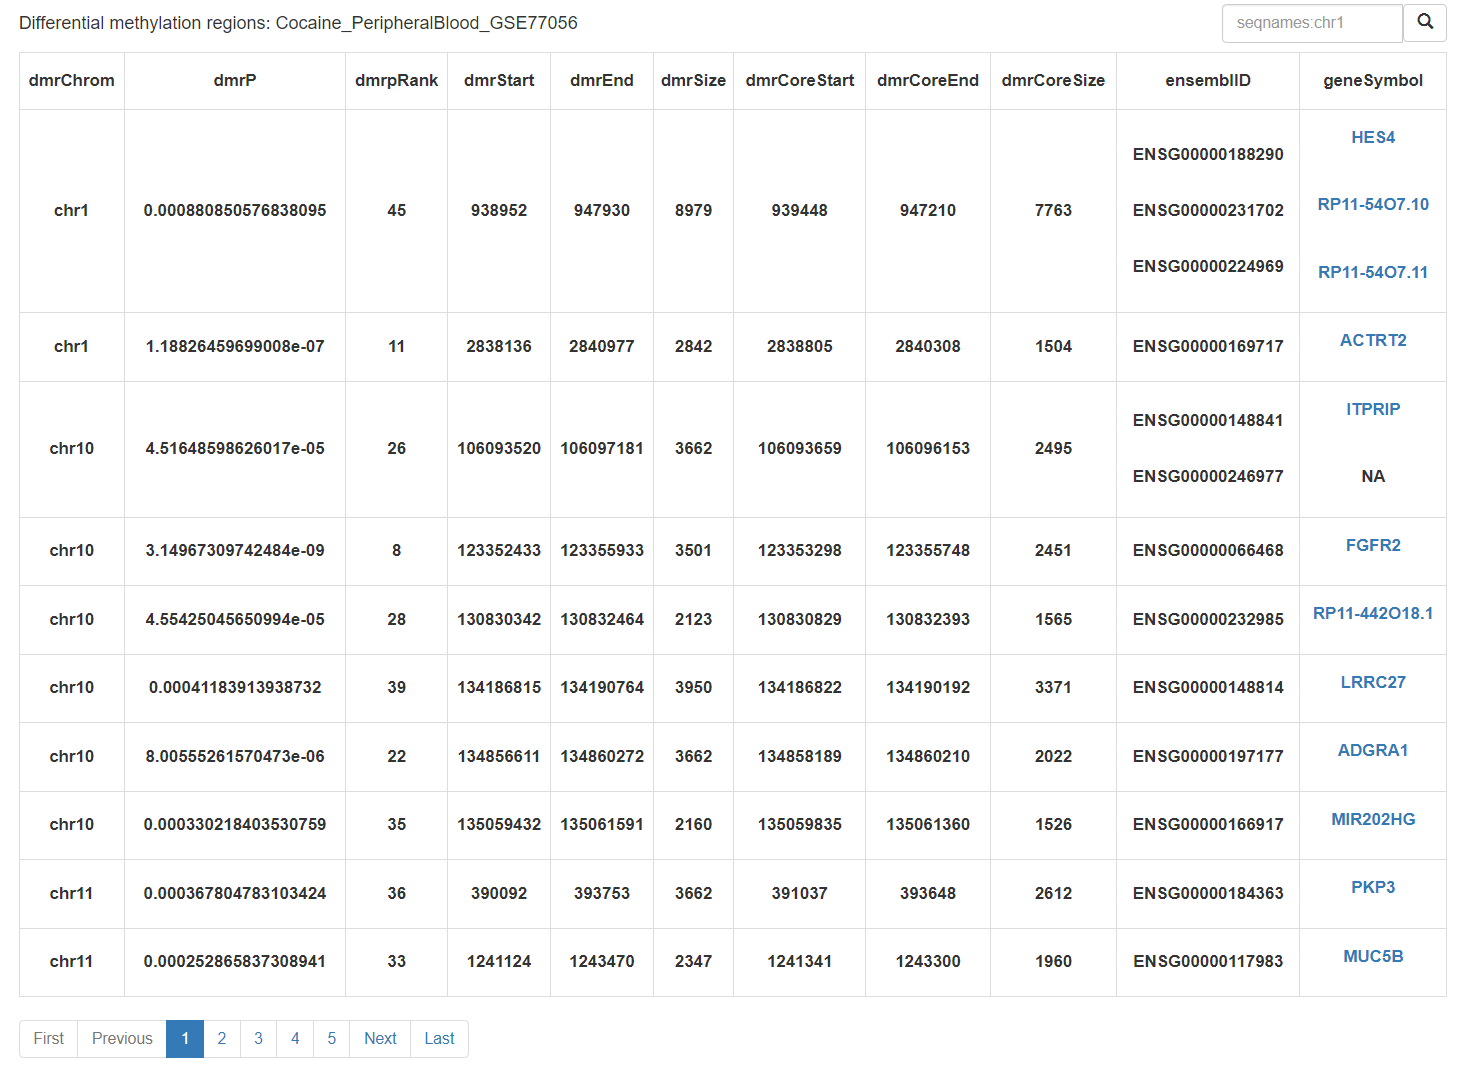
Users can click on the differential gene name to obtain detailed information about the gene.
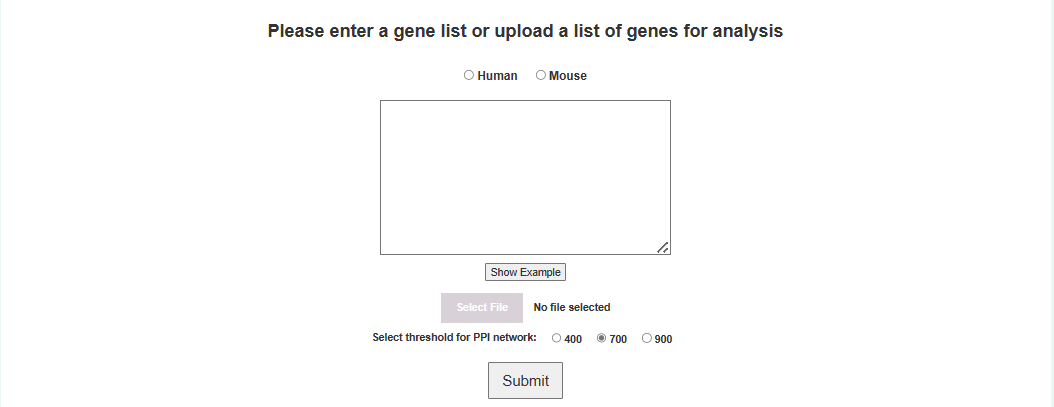
Users can input a gene list or upload a gene list to obtain analysis results.
PPI network of uploaded gene lists:
The centrality algorithm results of the PPI network for the uploaded gene list:
Key gene lists:
Click the download button below to download the centrality algorithm results for all genes. Click on the gene name to see the detailed analysis results of that gene.
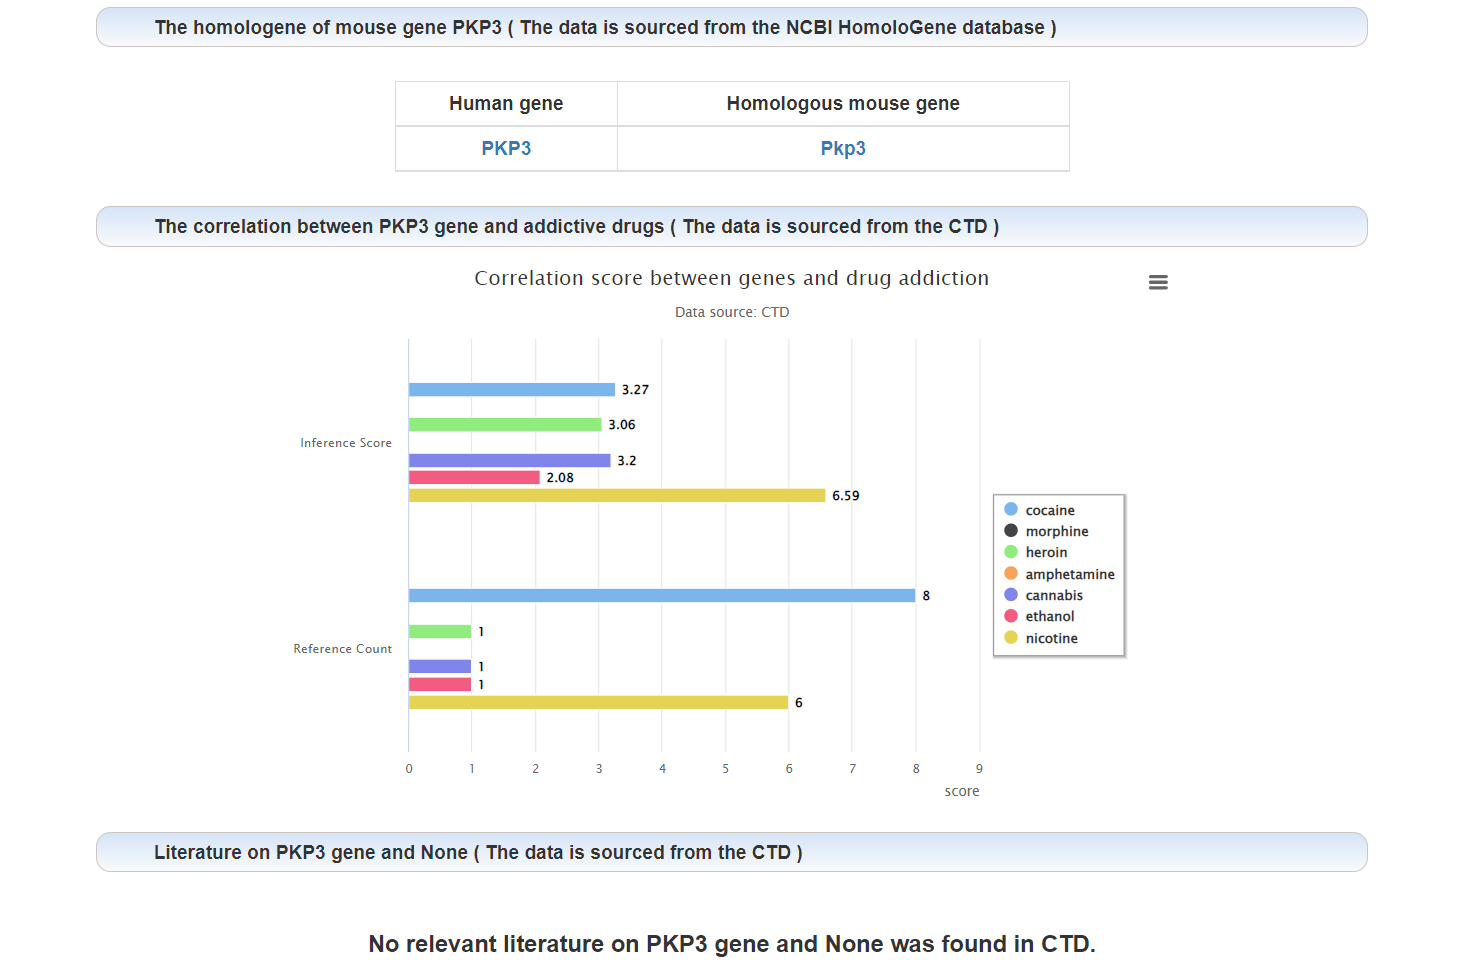
The homologous gene of this gene:

The expression level of this gene in different brain regions of human:
The expression level of this gene in different brain regions of mouse:
The correlation between this gene and addiction:
Literature on the relationship between this gene and addiction:
Users can choose species, addictive drugs, brain regions, datasets and DEGs thresholds to download transcriptome data analysis results.
Users can choose addictive drugs, tissue / cell, datasets and DMPs thresholds to download methylation data analysis results.